Brydg Democratizes Real Estate Data with the launch of Latitude

The stock exchange style ticker for UK property values further supports investors seeking CBILS loans.
In working with the British Business Bank in supporting SMEs through CBILS lending, we understand the need for speed, transparency and certainty in times of volatility. In order to address this problem in real estate lending, Brydg Labs is excited to publicly release our Local Area Transactional Intelligence Ticker…we know it’s a mouthful, that’s why we call it Latitude!
Latitude helps real estate investors, developers or just home owners better understand a property’s value in real time. This evens the playing field with major corporations, who have vast resources and data available at their fingertips.
For most of us, our homes are the most valuable assets we have and yet there is so much uncertainty around the true value of these assets. One of the most important indicators of how much a property is worth is known as Average Price Per Square Foot. This is derived by dividing the total area size of a property by it’s sale price.
As easy as it sounds, it’s actually quite complex when you have to calculate this for a large area of multiple properties across different geographies. That’s where our Data Science team comes in.
Technology and Methodology
As a human automatically processes data, with full accountability by detecting and flagging anomalies then excluding them from analysis, so does Latitude.

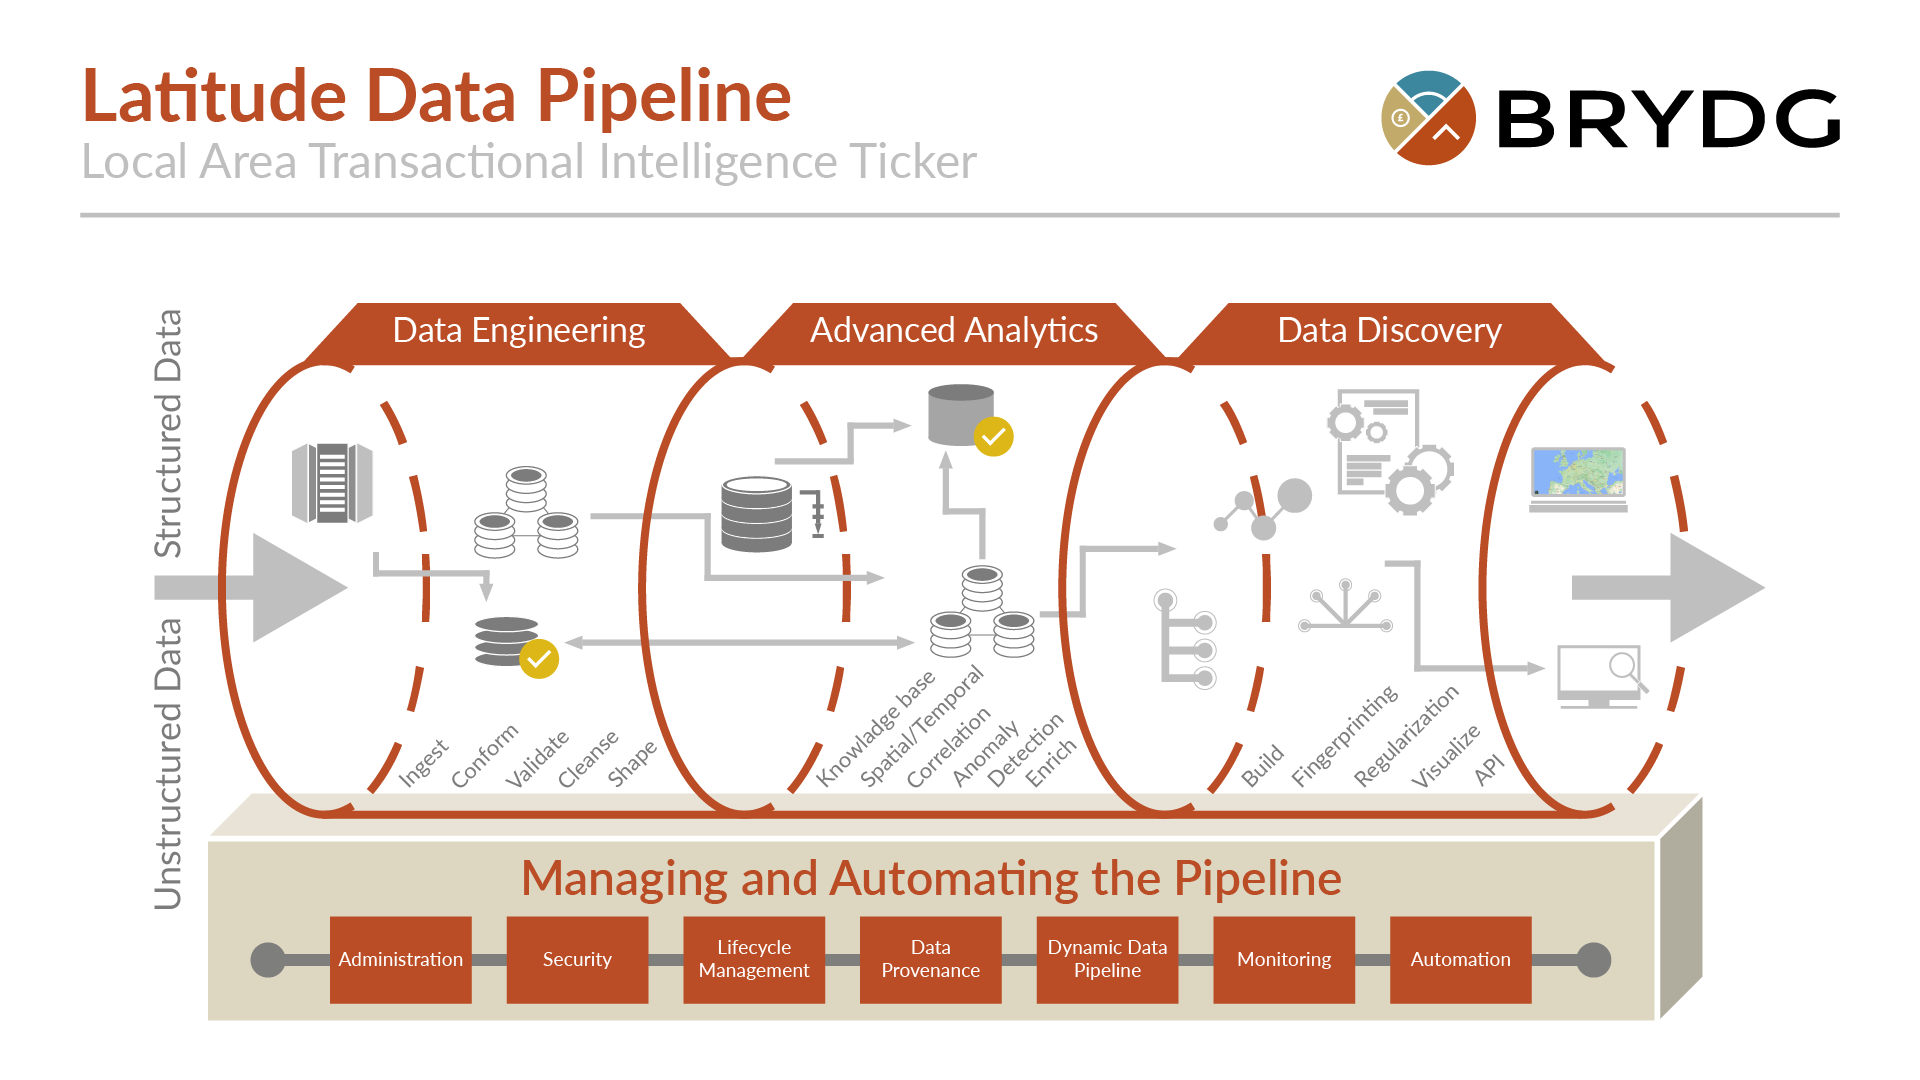
In order to get this single source of truth view, we ingest structured and unstructured data from various data sources and then correlate all the data into a unified picture using a proprietary knowledge base built on top of Hilbert spaces. This allows us to express any type of probabilistic and logical relationship within the data.
We then analyse data further through hierarchal processing, in much the same way the visual cortex is built, in order to detect anomalies in the data, flag unreliable datapoints and dynamically understand temporal and spatial patterns.
As the data starts to normalize through our data pipeline, we run anomaly detection, regularization and start decoding to translate postcodes, sectors and districts into natural administrative regions, counties and boroughs.
Once we have this raw data, it needs to be democratized for public consumption. This requires our UX team to create a heuristic user interface to visualize the data.
How to read our ticker:

Each capsule in the ticker contains the following information:
- Outcode (Area & District) – This refers to the designated area identified as region, borough or postcode.
- Relative Identifier – This symbolizes where this area is relative to the tab. The dotted line represents the average of the area. A single dot above or below the dotted line denotes if the area is more expensive or less expensive then the average of all the areas displayed on the ticker.
- Price Per Sq. ft. – This is the average price per square foot of real estate in this area as of the most recent monthly data available.
- Price Change – Represents the annual price change in this area.
- Transactions – The number of sale transactions completed for the area in the defined month.
- Period Change – The change in number of sale transactions completed from the same period last year.
Data:
As of the writing of this article, there are exactly 1,765,422 total Postcodes broken down into 124 Areas, 2,982 Districts and 11,204 Sectors.
The data is updated monthly but delayed by one quarter due to the UK Land Registry processing times.
If you would like to learn more about our Latitude ticker or use it for your business, please email labs@brydg.com. Thanks for joining us on our journey to bring better data to real estate finance!
View Changelog
View Desktop Only Version
Additional Brydg:
Website: http://brydg.com
Twitter: https://twitter.com/Brydgcom
Facebook: https://www.facebook.com/pg/brydg/about/
LinkedIn: https://www.linkedin.com/company/brydg/
Instagram: https://www.instagram.com/brydg_/


